This page provides modeling diagnostics for the analysis presented in “Revisiting the environmental justice implications of CSOs with 2022 data”. For an explanation of the statistical methodologies underlying the analysis, see “Data analysis methodology for ‘Environmental justice implications of CSO outfall distribution’”.
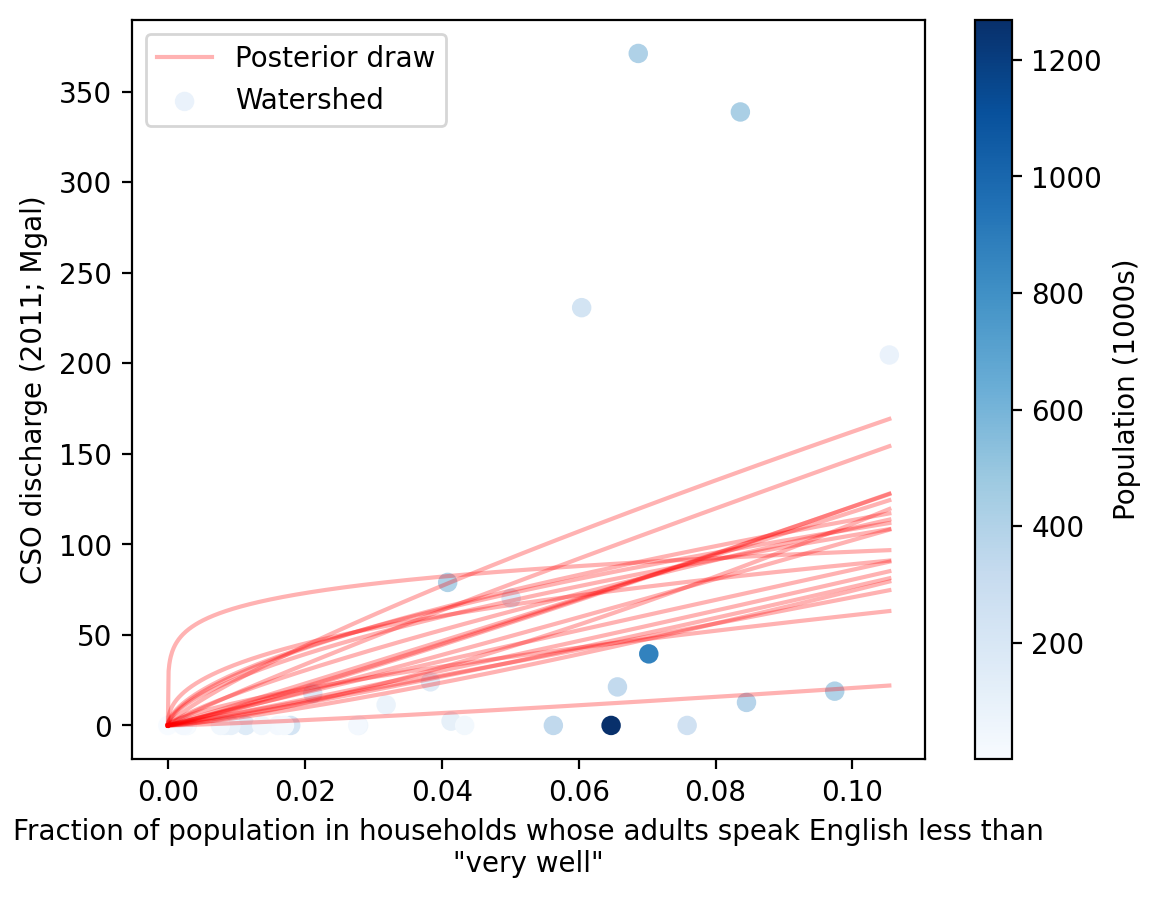
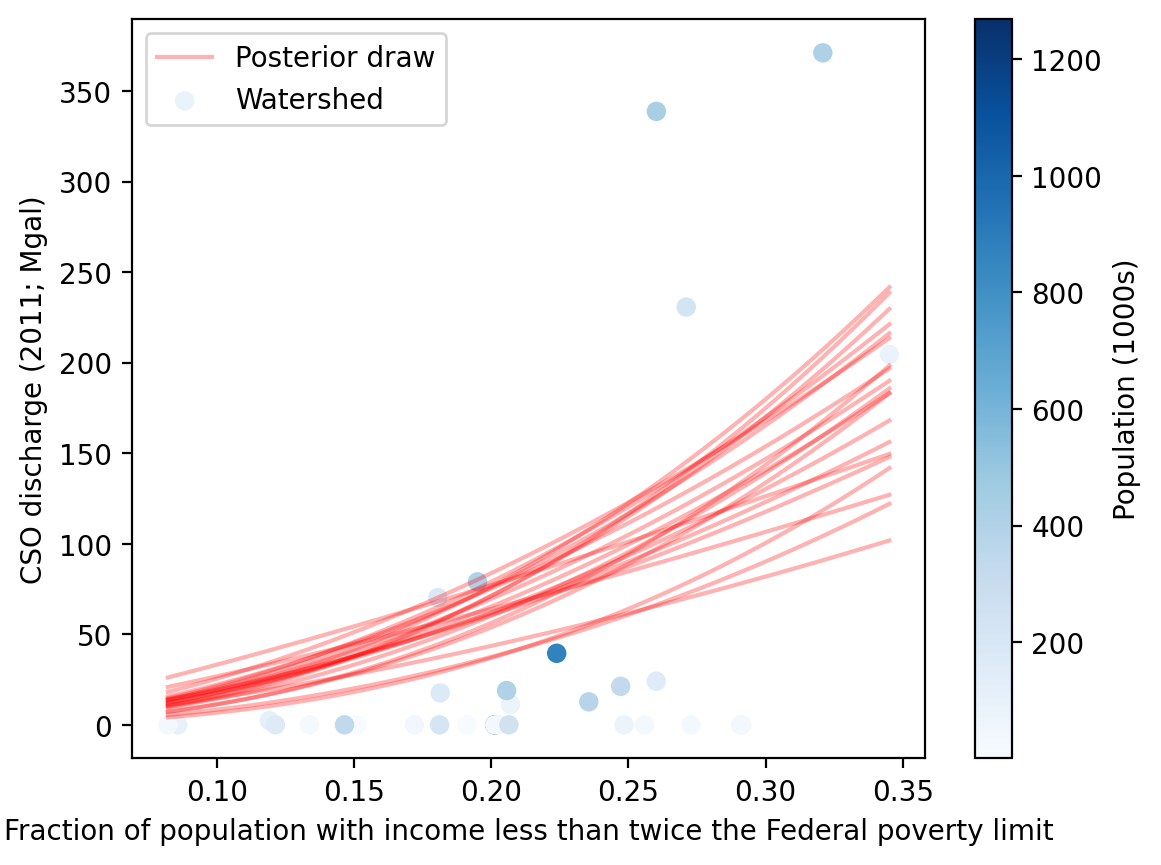
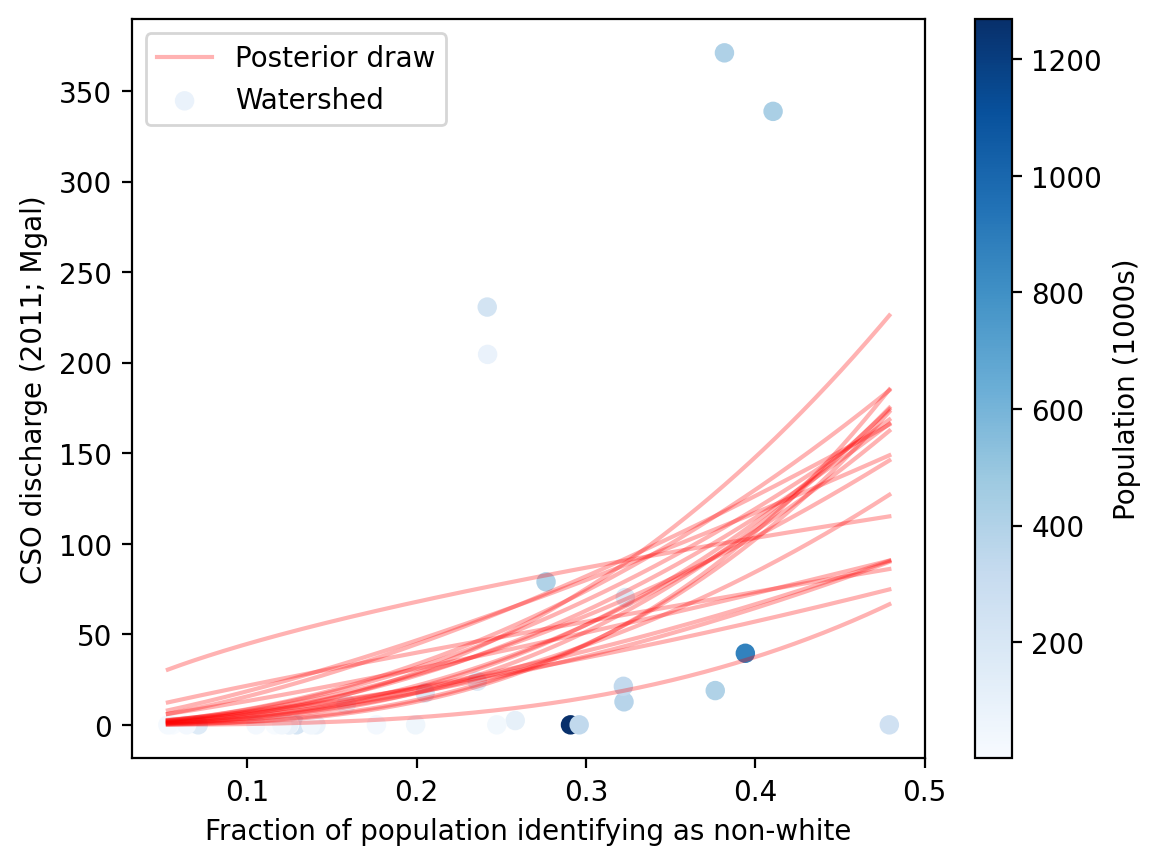
The plots below illustrate the functional form of the fitted model for each EJ indicator. A sample of random draws from the Markov Chain posterior are shown in red. The actual watershed data points are shown in blue, colored according to the watershed population used to weight the model fit.
The plots below show the posterior probability distribution of the dependence measurement β for each EH indicator, transformed as \(2^\beta\) to represent the growth of the dependent variable corresponding to a 2x increase in the independent variable.
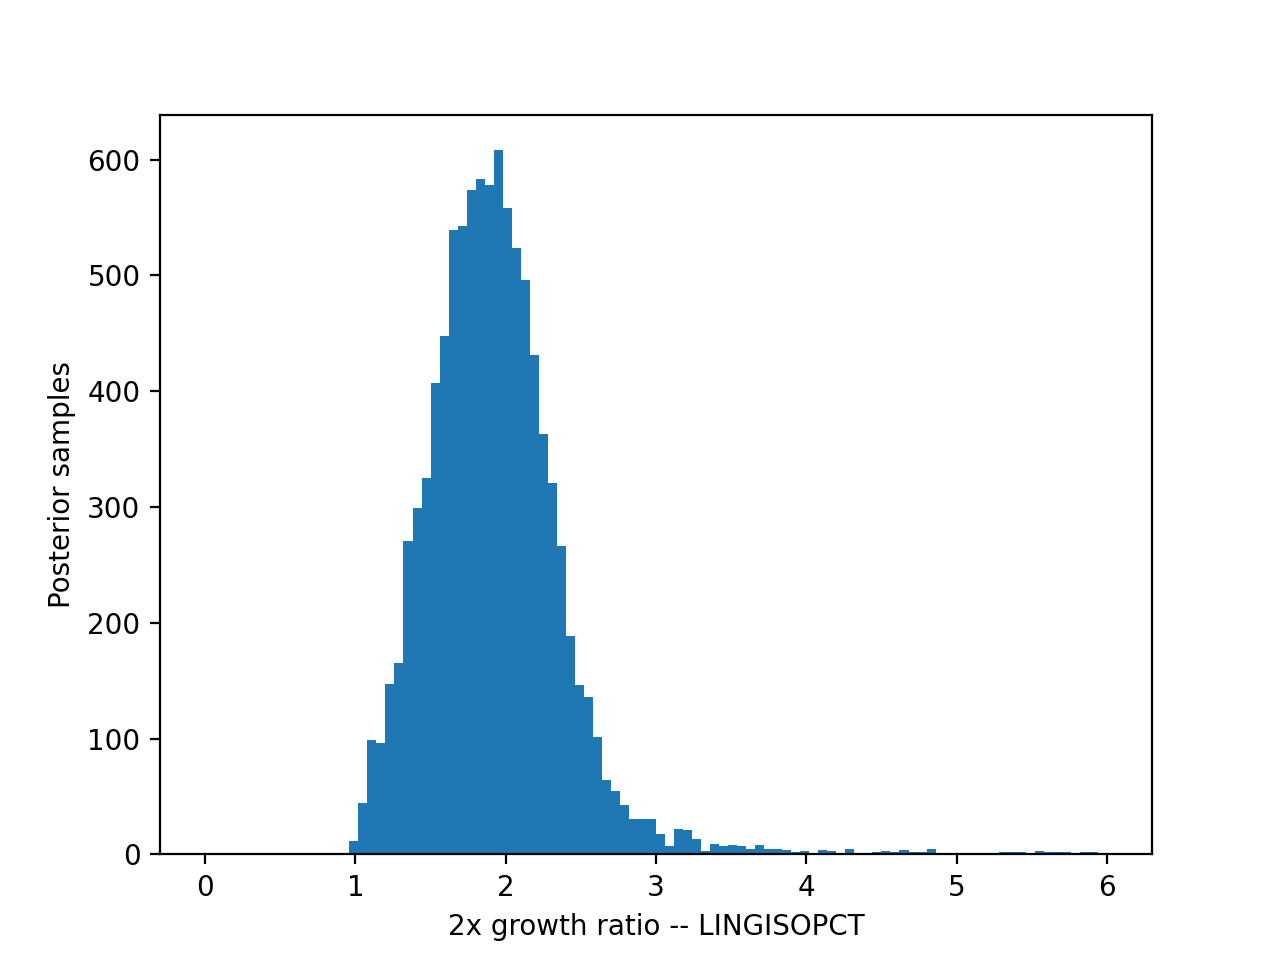
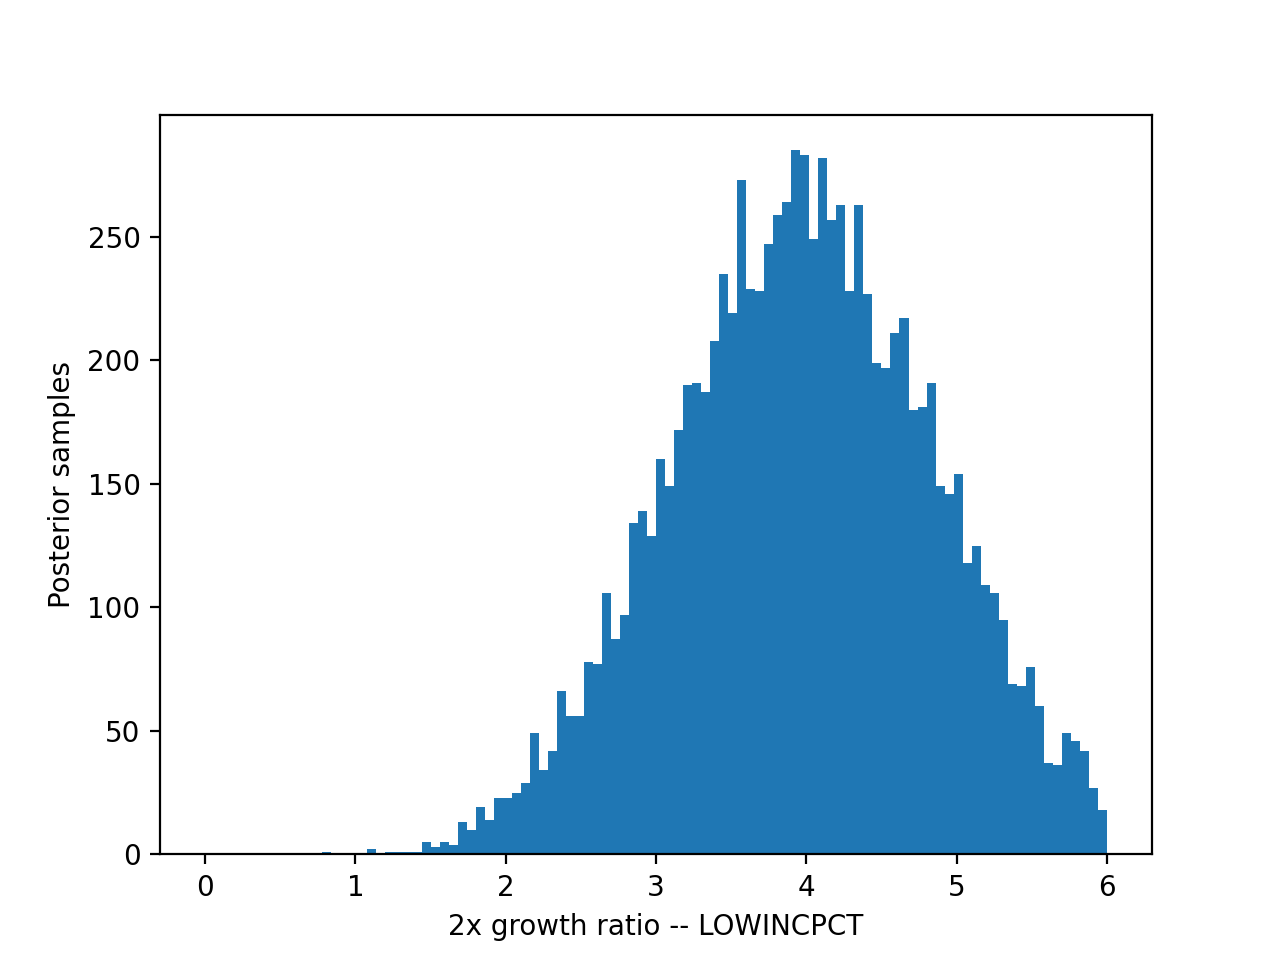
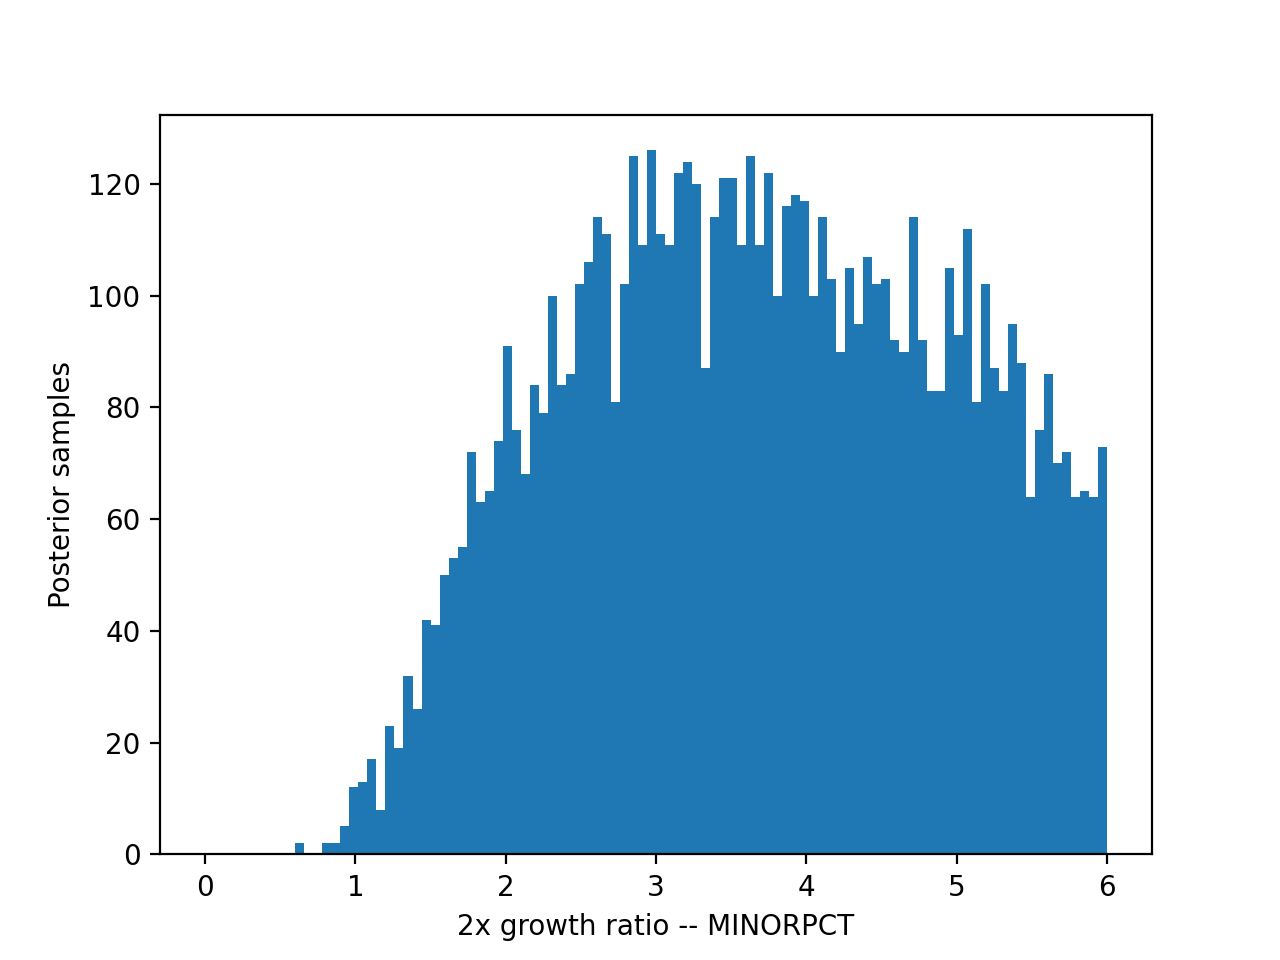
The 90th percentile posterior (confidence) interval of these distributions are quoted in the analysis page.