This page provides modeling diagnostics for the analysis presented in “Three years of MA sewage pollution data: trends, rainfall, and persistent environmental justice disparities”. For an explanation of the statistical methodologies underlying the analysis, see “Data analysis methodology for ‘Environmental justice implications of CSO outfall distribution’”.
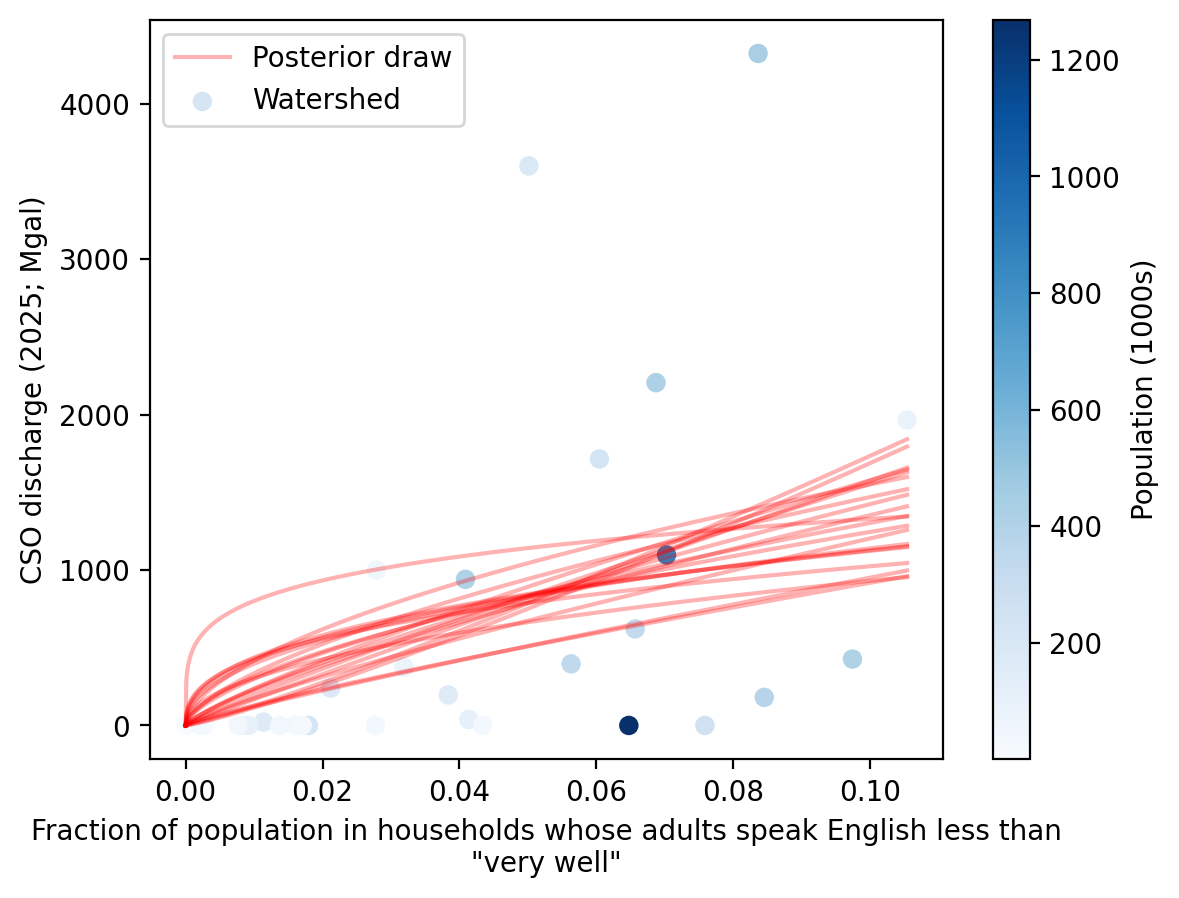
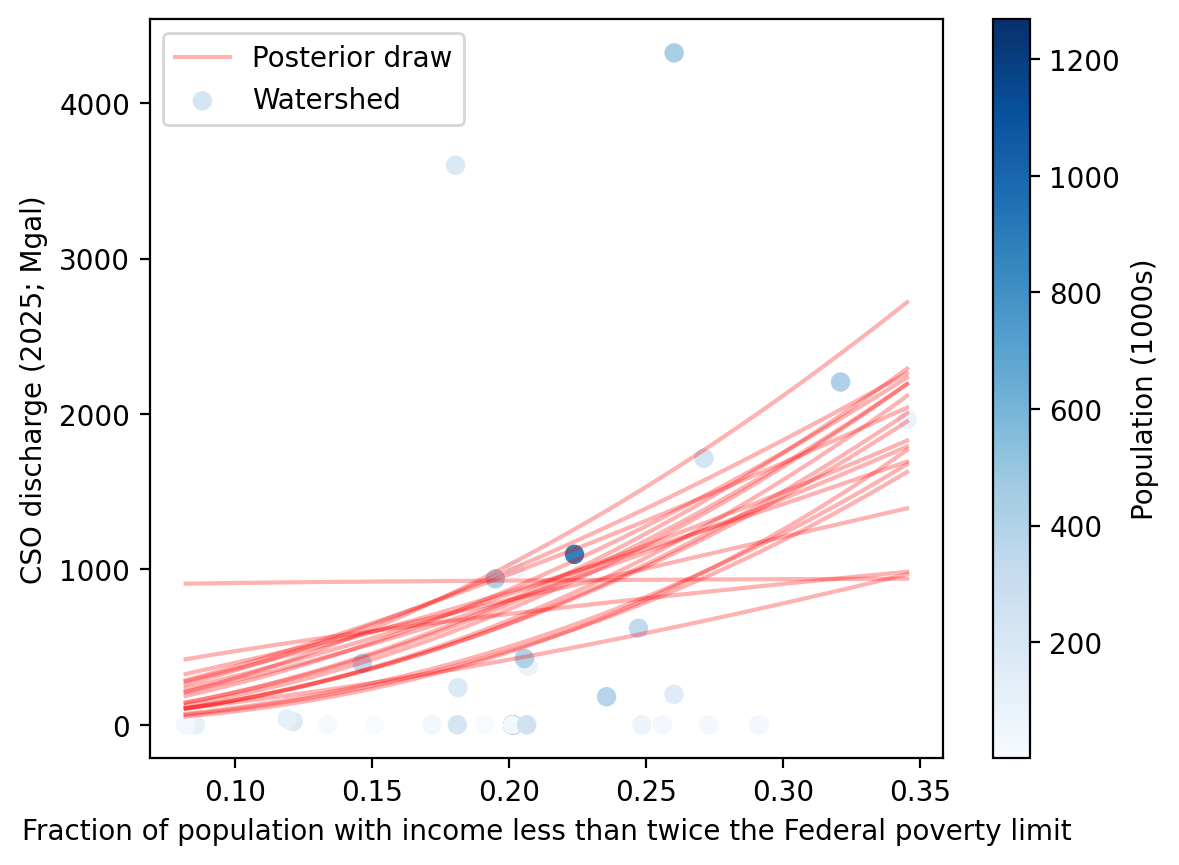
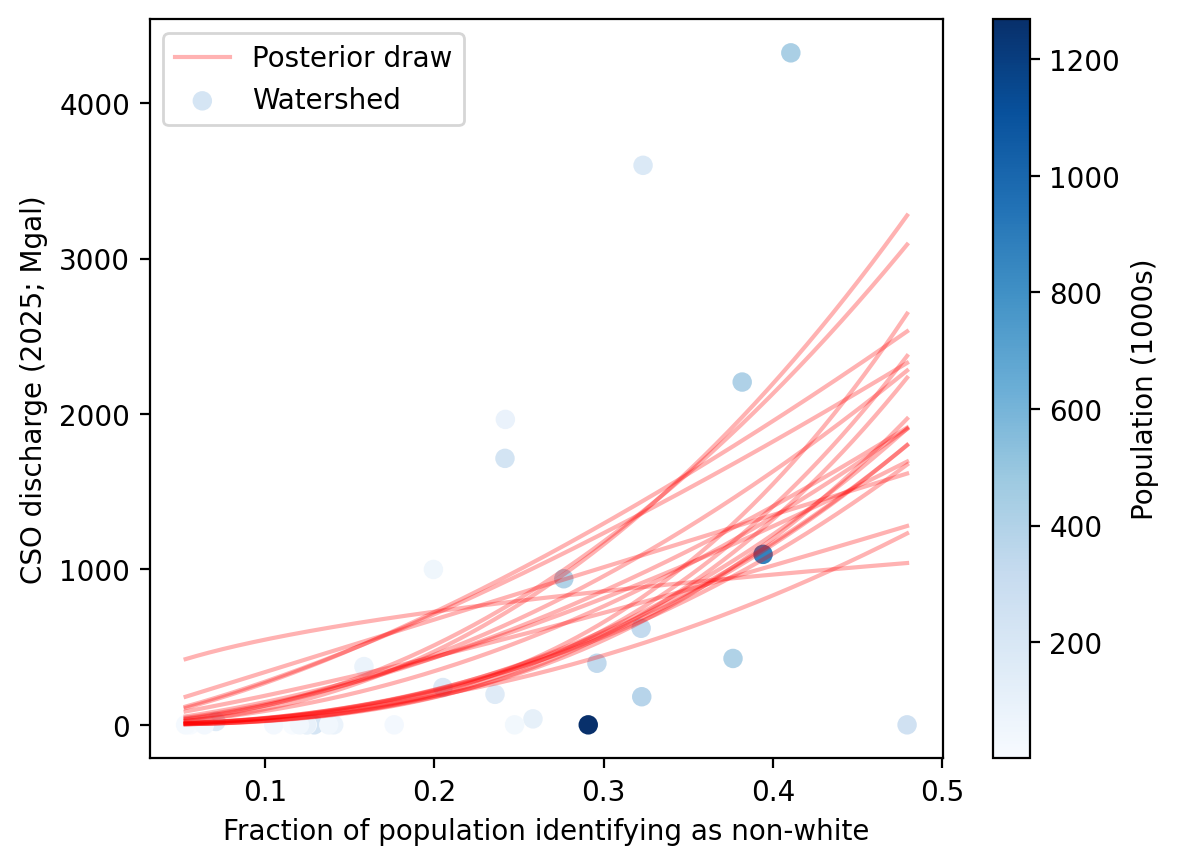
The plots below illustrate the functional form of the fitted model for each EJ indicator for the models fit to data from 2022 through 2025. A sample of random draws from the Markov Chain posterior are shown in red. The actual watershed data points are shown in blue, colored according to the watershed population used to weight the model fit.
Year-by-year and overall model comparison
To assess whether EJ disparities are stable across the entire 2022–2025 period or driven by year-to-year variation, we fit separate watershed-level regression models for each full calendar year (2023–2025) as well as an overall model that pools all data from the entire June 2022 – December 2025 period. The posterior distributions of the estimated 2× growth ratios (the multiplicative effect on discharge burden for a doubling of each EJ indicator) are shown in the interactive plot below.
Note: Y-axes are scaled to the 99th percentile of each distribution to improve readability. Outliers beyond this range are still included in the box-and-whisker statistics.
Fraction non-white
Fraction low income
Fraction linguistically isolated
Interpretation: Each box-and-whisker plot shows the posterior distribution of 2^β for one EJ indicator and one analysis period (annual or overall). The horizontal line inside the box is the posterior median; the box shows the middle 50% of samples; and the whiskers extend to show the full range. Larger boxes indicate higher posterior uncertainty. The “overall” estimate pools all discharge data from 2022–2025 and provides a single best estimate of the EJ correlation magnitude across the full period. The annual estimates show that the correlation is remarkably consistent year-to-year: minority population and income disparities are present in every year, and linguistic isolation disparities, while somewhat variable, remain statistically significant.
The 90th percentile posterior (confidence) intervals of the overall estimates are quoted in the main analysis page.
This post was prepared with assistance from Claude, an AI assistant, which helped structure the analysis, write code, and draft text. All data, methodology, and conclusions were reviewed and approved by the site author.